Automated grid
capacity assessment: How Glitre Nett improves connection processes with DataArena and the IGP

Norway is undergoing a massive wave of electrification, set to raise electricity demand by 80 TWh by 2050. Driven by industrial decarbonization, hydrogen production, and new energy-intensive industries, this transition puts pressure on DSOs like Glitre Nett. Connection requests are rapidly increasing, but available capacity is already tight in many regions — and often assigned on a first-come, first-served basis.
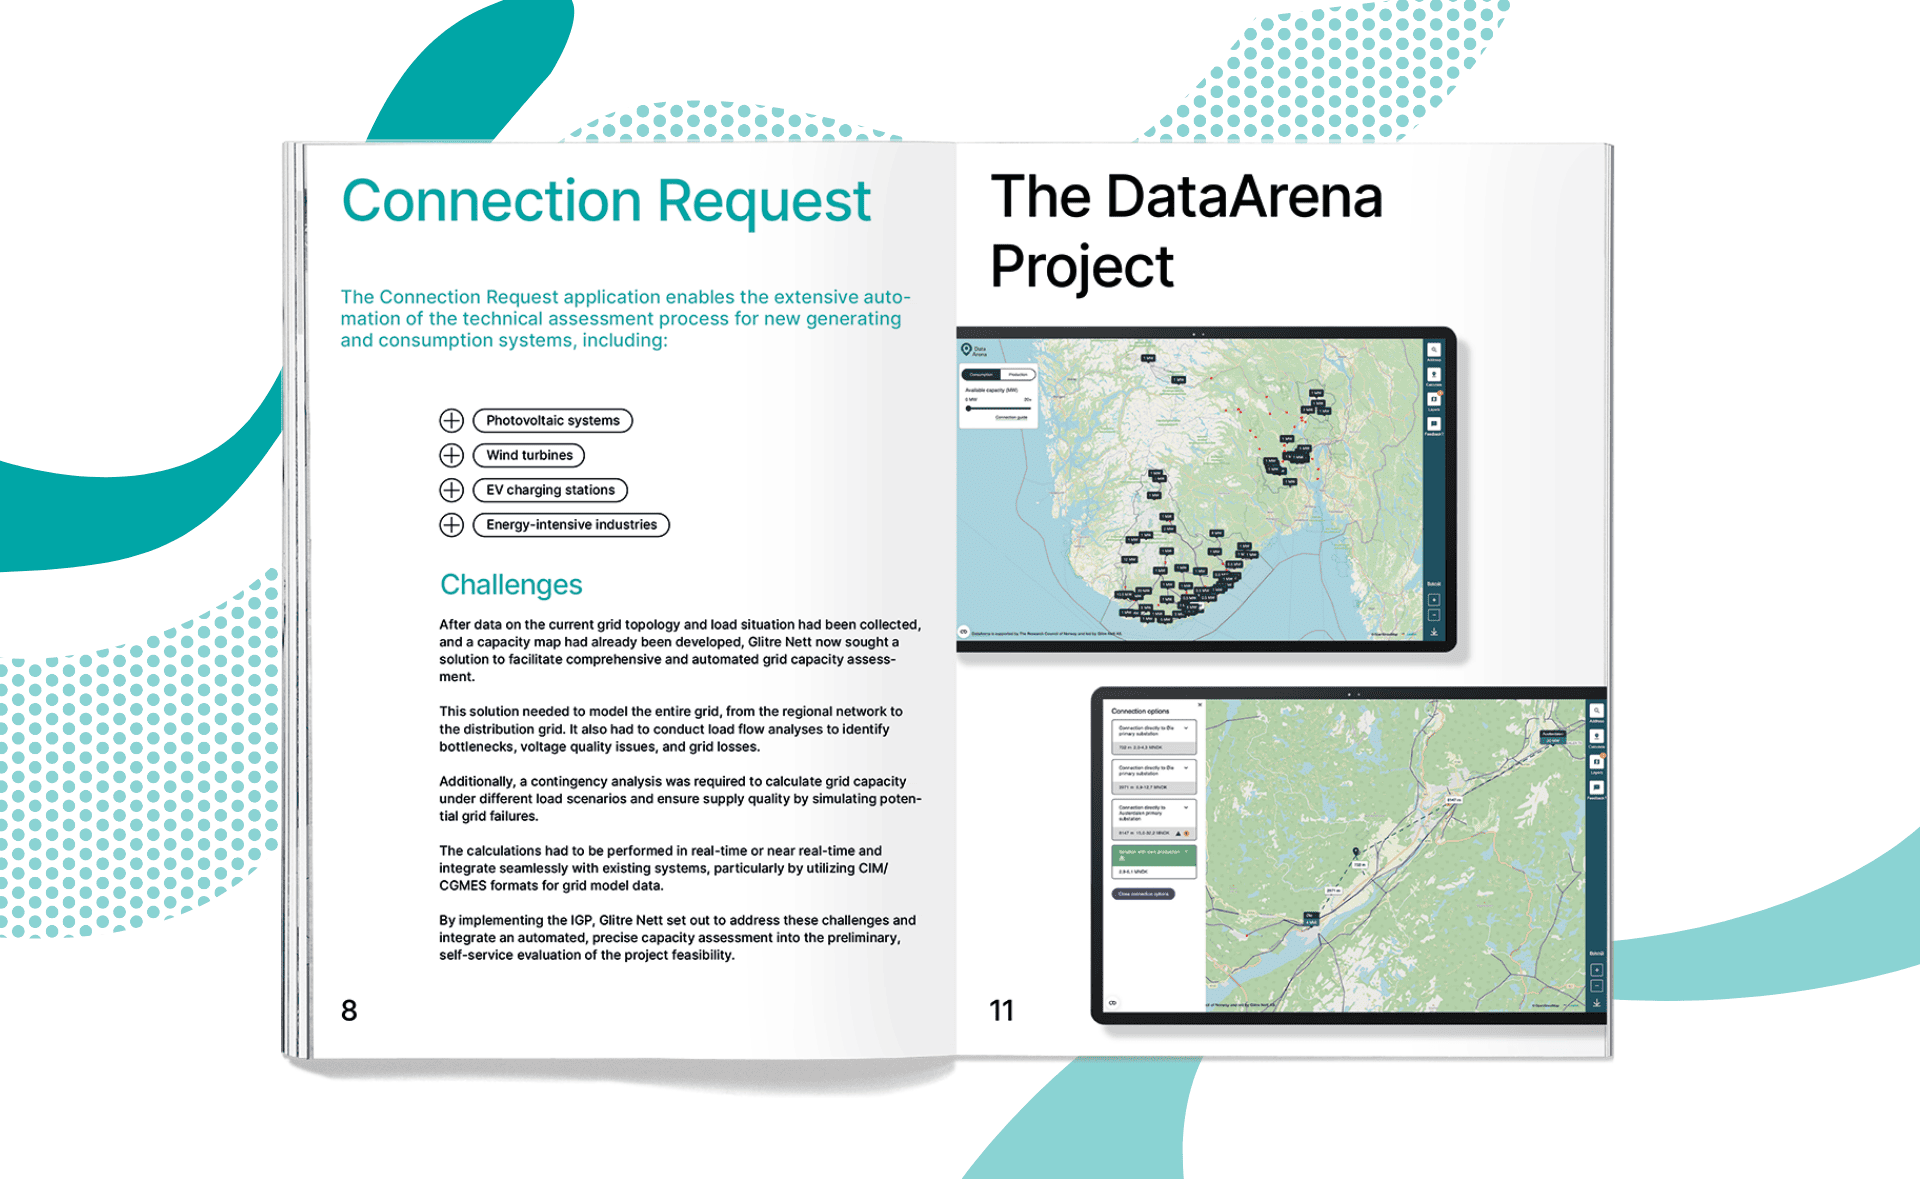
To improve transparency and speed in this high-demand environment, Glitre Nett launched the DataArena project. The goal: enable large consumers and producers to assess connection possibilities early on and reduce bottlenecks in the process. While the map had already been developed by the Norwegian DSO, it lacked an automated method for calculating grid loads and identifying suitable connection points.
In the case study, you’ll learn:
- What it takes to turn a static capacity map into a living simulation tool that provides accurate overview of most suitable connection points
- Why Glitre Nett wanted to enable contingency analysis to calculate the available grid capacity
- How the implementation was designed to keep grid model data current — and ensure assessments reflect the real grid state
Download the case study on self-service capacity assessments now:
You can get your copy of the case study straight away after submitting this form. If you have questions about the automation of capacity assessments and speeding up the processing of grid connection requests, you can add an optional message.
Contact person
Kerem Mermer
"Making grids smarter
for a sustainable future worldwide!"


