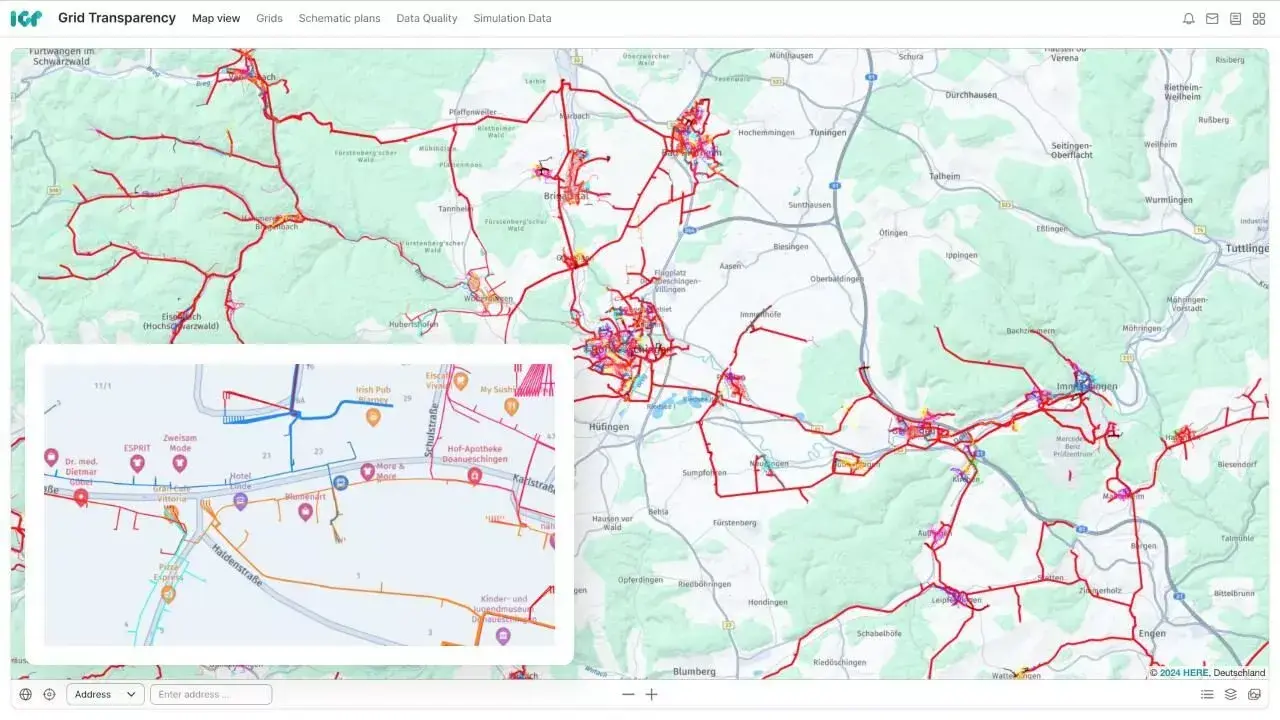
Comprehensive visualization options
Our app provides a detailed, map-based view of the entire grid area, allowing for clear distinctions between different voltage levels, as well as specific sections and branches of the grid. Additionally, you can integrate extra maps and data sources into the visualization. A schematic view allows users to understand the grid structure and topology at a glance.
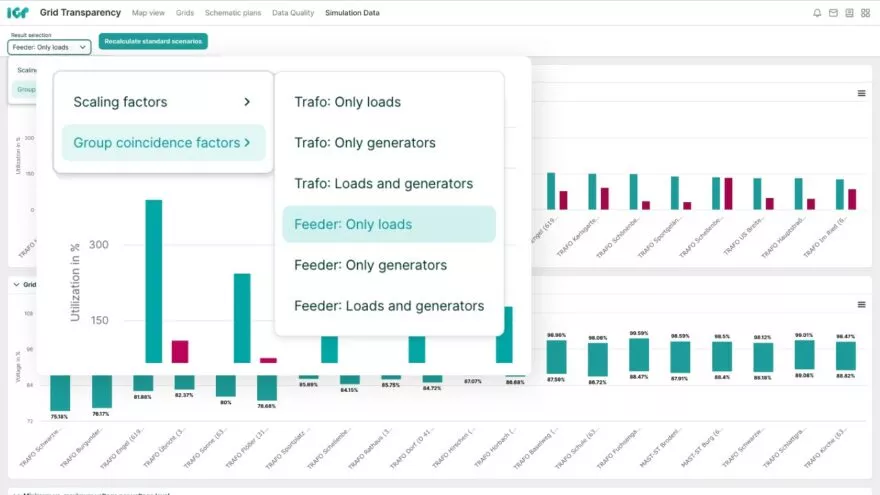
Automated simulations for the entire grid
The grid load and voltage curves of each asset are automatically assessed for all grids based on your planning principles. This can be achieved using simulations based on coincidence factors or time series data. Short-circuit analyses can also be performed. Altogether, this gives you a comprehensive view of the entire situation in the grid.
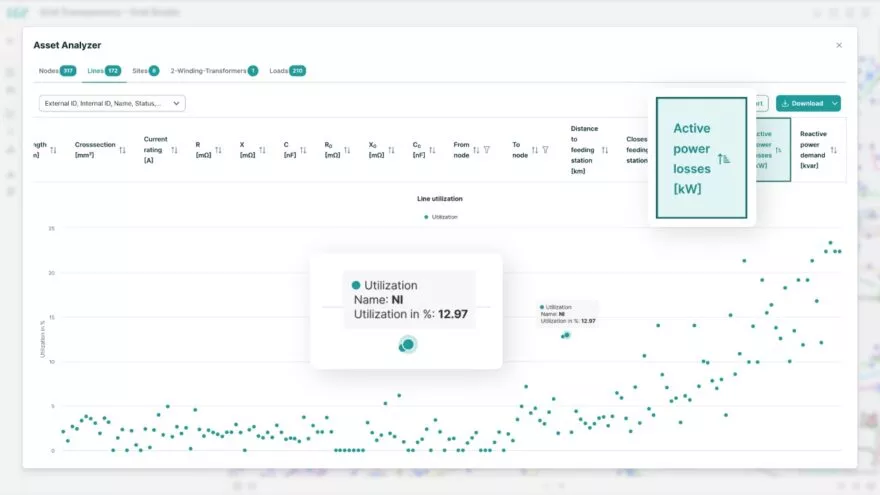
Advanced parameterization and comprehensive evaluation of grid assets
Thanks to flexible parameterization of key inputs like coincidence factors and thresholds, you can tailor simulations precisely to your grid conditions. Additionally, you get detailed information on each grid asset, including all technical parameters and extreme values and frequency distributions from the simulations. These insights enable thorough grid load evaluation and help monitor critical areas in the grid.
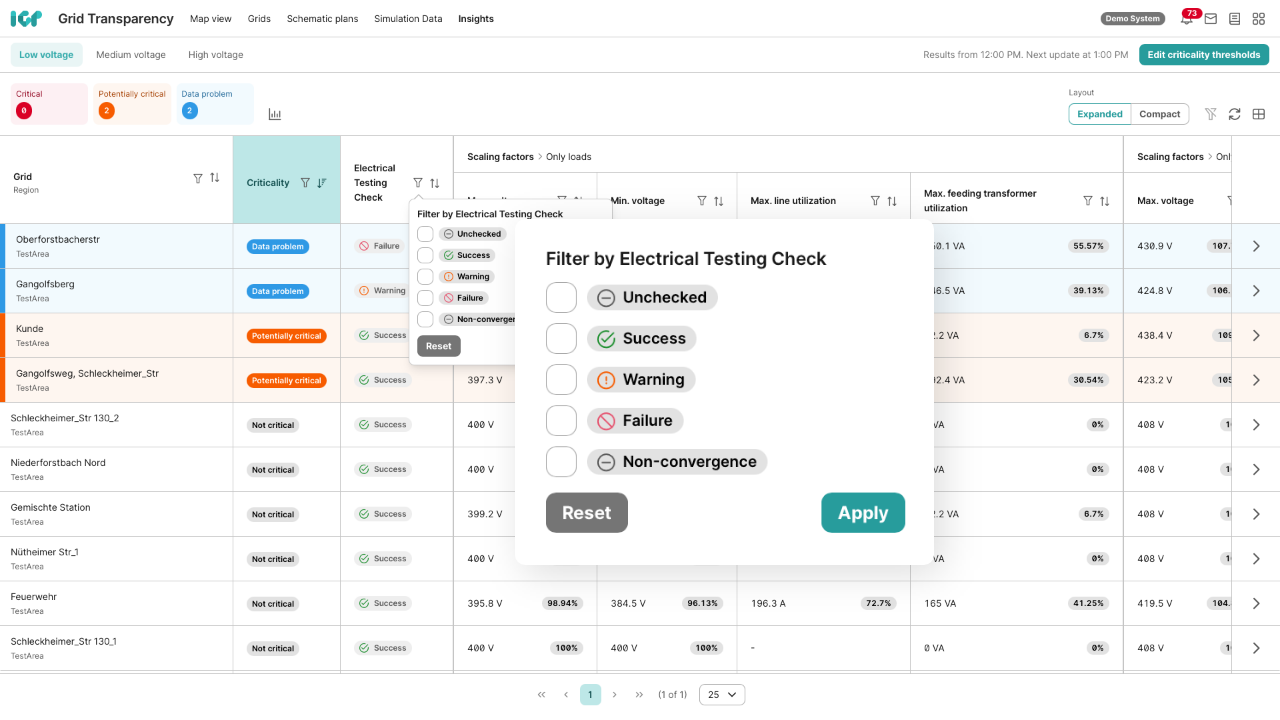
Criticality assessment: Centralized overview and monitoring across your entire distribution grid
Giving you a centralized overview of all relevant grid information from both planning and operations, the app provides a criticality assessment of your grids, including status tracking. Color-coded criticality levels help you quickly identify the right actions and focus operational attention where it is needed most.
With advanced filtering and sorting functions, specific grid areas can be easily analyzed and prioritized. Key metrics, such as transformer and line loading, are clearly displayed in the table. The electrical validation status makes it easy to identify weak points in the grid at a glance, helping you assess grid quality, detect potential issues early, and define the right actions. The result is targeted resource planning instead of reactive, one-size-fits-all decision-making.

All grid data in one place
The app consolidates all relevant grid data and makes it accessible in one central location. This provides a complete overview of the entire grid, simplifies many workflows, and enables a detailed analysis of both grid structure and grid load.

Advanced analyses
By connecting previously siloed data, our app enables comprehensive analyses and simulations built on a centralized data foundation. This includes grid hosting capacity assessments, a criticality check, and a range of grid simulations that support precise, well-informed decision-making.

Better grid planning
Evaluating the current grid load provides crucial insights for grid planning. Bottlenecks can be identified early, even without measurement infrastructure. This helps prioritize grid expansion measures and ensures better use of available resources (financial and personnel).
Contact person
Dr. Tobias Falke
VP Global Sales & Marketing