Integration and analysis of various measurement parameters
The app allows the integration of measurement data from different sources and visualizes parameters such as current, voltage, and power for in-depth operational data analysis in your distribution grid. The app supports a wide range of protocols and standard interfaces with established measurement device providers, bringing all metering data and sensor data into one unified location to maximize its value and make it easily accessible for a variety of processes.
The Intelligent Grid Platform (IGP) supports multiple integration approaches. You can choose to store your measurement data in an existing backend or use the Time Series Control Center with TimescaleDB technology for storage. The latter allows to avoid duplicate data storage and enhances the efficiency of operational data management.
Trends prediction in your distribution grid through time-series data analysis
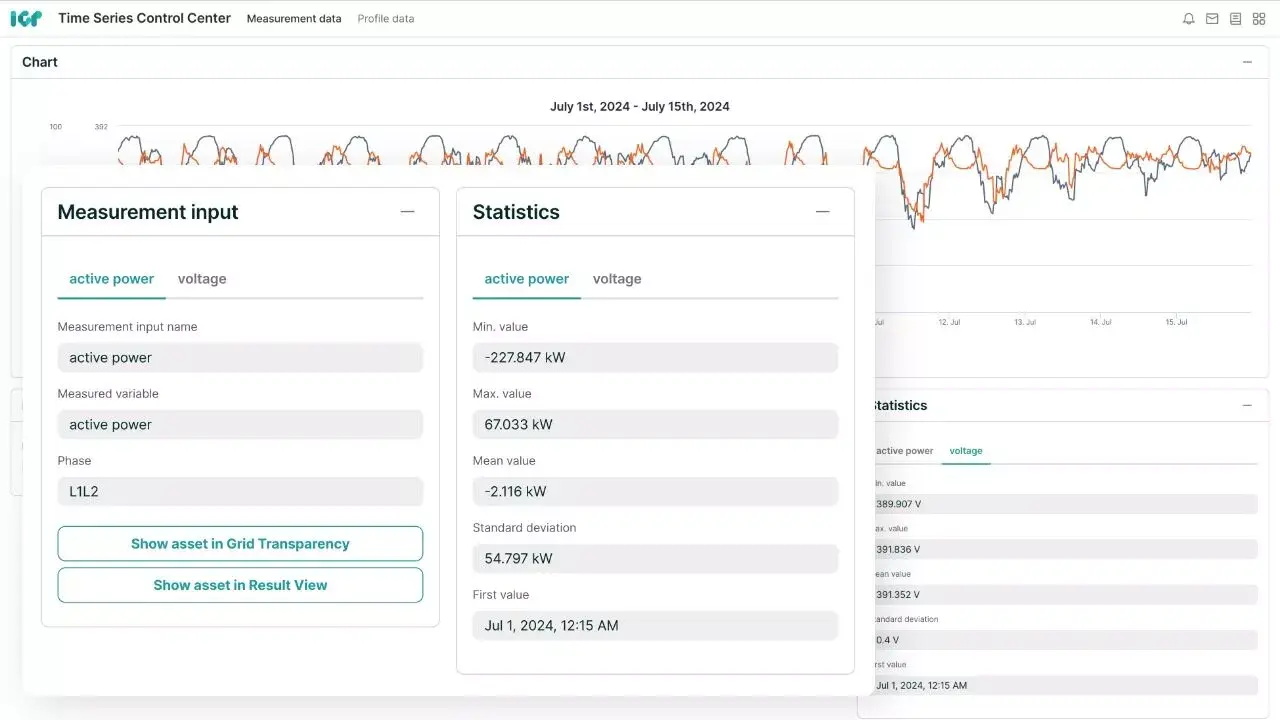
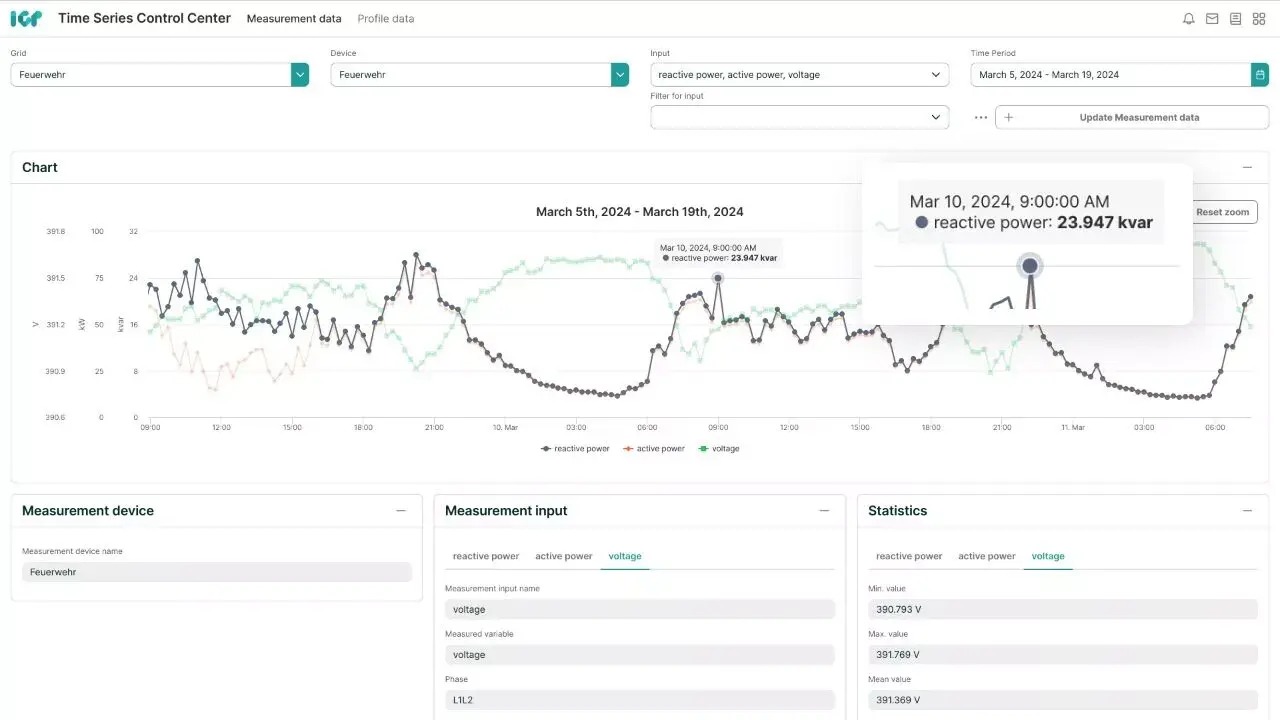
The Time Series Control Center allows flexible metering data analysis as well as substation data analysis and visualization over time – whether in real-time or across hours, days, weeks, or even years. You can validate that measurement devices are integrated correctly and that data import is functioning as expected. The analysis of long-term voltage trends or load fluctuations from the metering and sensor data can offer critical insights into when grid expansion might be necessary.
You can investigate real-time shifts in power flows and voltage levels in the grid and take immediate action when needed. The app’s ability to perform extreme value analysis further aids in identifying potential problem areas early on, allowing for targeted action. Data export options are available to conduct further analysis in other systems and maximize the insights gained.
Thus, the app enables trends prediction in your distribution grid, helping you anticipate changes in grid performance and address issues before they become problematic.
Grid model integration for better planning and operations
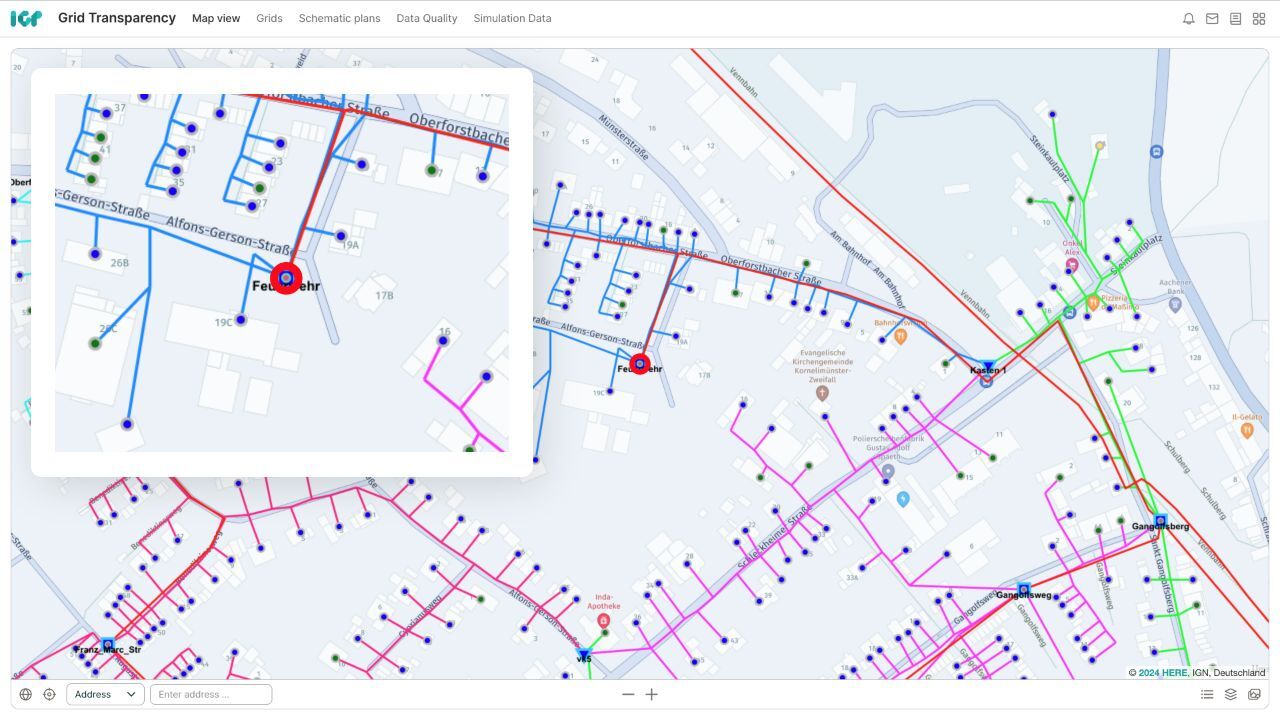
Each measurement device is linked to a specific asset (such as a transformer or line) or a grid connected element such as PV or smart meter within the grid model. This allows metering and sensor data to be directly utilized for grid planning or operational processes. For example, you can easily switch between historical grid data and simulation results to validate your planning assumptions. Alternatively, you can use real-time grid data directly for state estimation or flexibility management and its subsequent processes, such as device control.
The Time Series Control Center also allows users to manage how operational data from measurement devices is incorporated into different applications, improving the quality and relevance of various types of analyses and calculations.

More accurate grid planning
The app makes metering and sensor data from your distribution grid available for comprehensive analysis and grid planning. This allows you to compare real-time and historical grid data with simulation results, ensuring your planning processes are more reliable.

Improved process workflows
All measurement data is visualized in a standardized format, ensuring consistent and easily understandable visualizations. The automated integration with the grid model ensures that the data is ready for downstream processes without additional effort.

Cost savings through
reduced redundancy
The Time Series Control Center helps reduce costs by eliminating the need for a separate measurement data backend such as MDM, EDM or EMS. It integrates all operational data from measurement devices in one central location, removing the necessity for multiple proprietary systems.
Contact person
Dr. Tobias Falke
VP Global Sales & Marketing