.png "Connection Request")
Combine data from various sources
Using the flexible interfaces of the grid hub, you can easily integrate live data from various sources (smart meters, substation monitoring, SCADA, etc.) and combine them with structural grid data to get the most accurate view of your MV and LV grids.
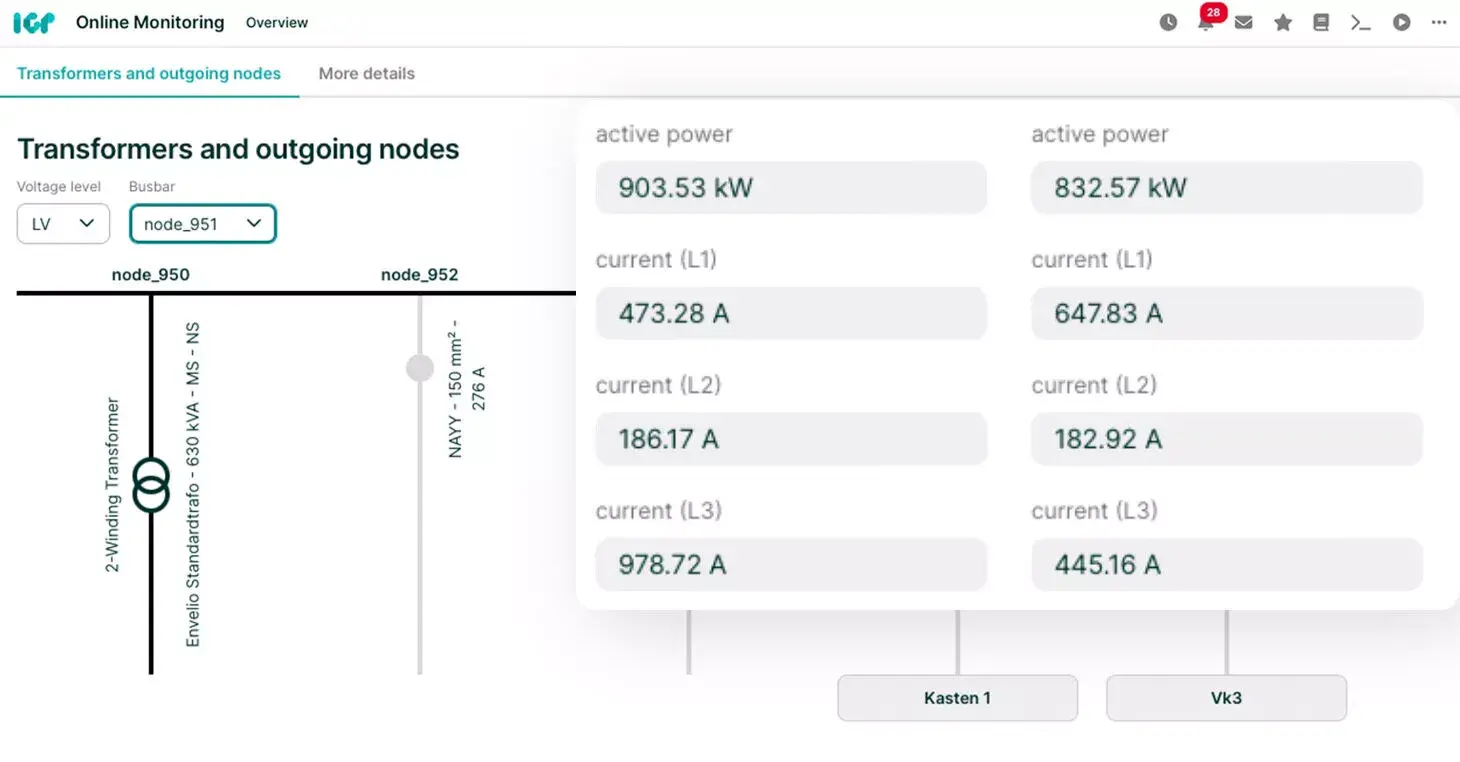
Visualize data for better load monitoring
By visualising your grid and all necessary data (asset data, sensor data, switching states, etc.) at one place, you can quickly identify critical or over-utilised assets and grid segments, support the planning of switching operations and the shutdown planning.
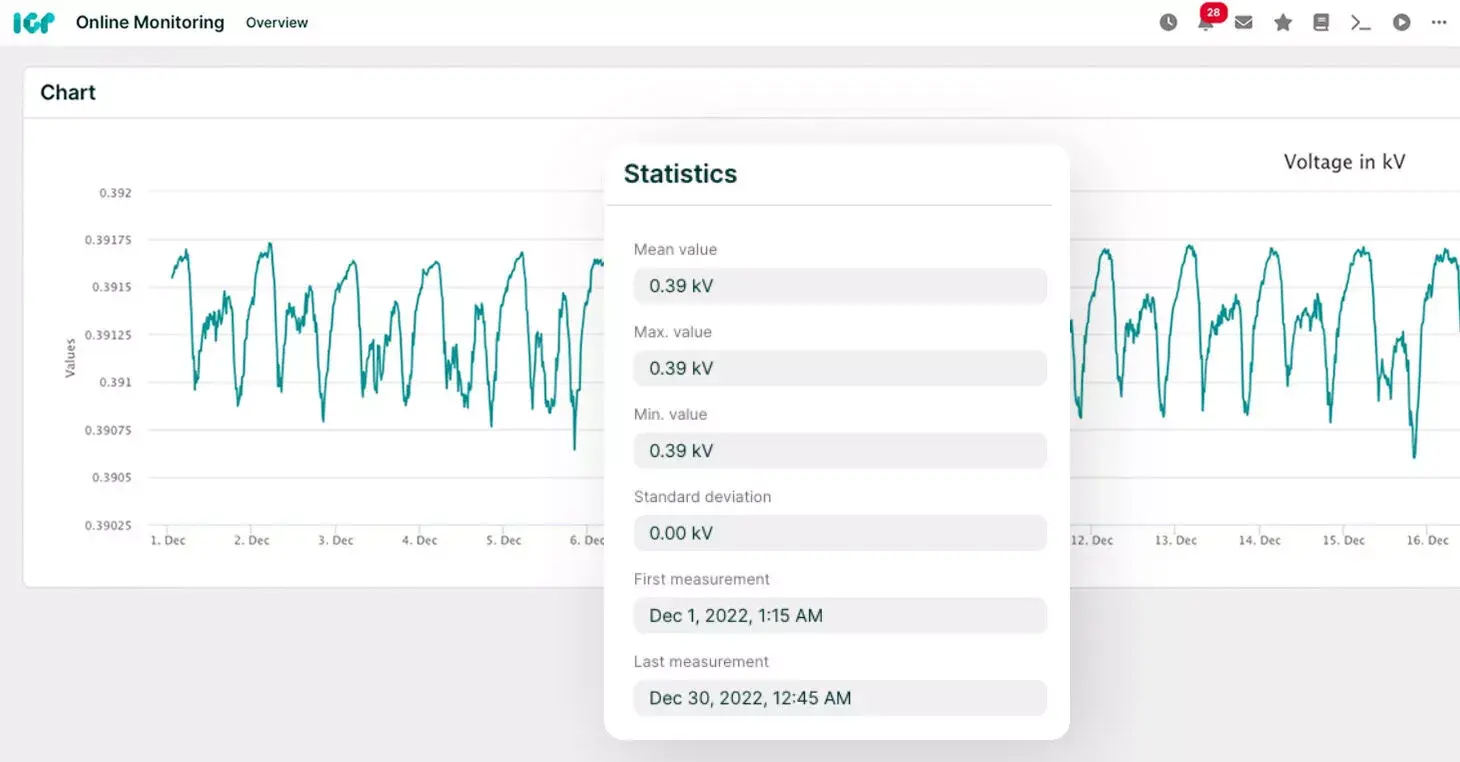
Get accurate state estimation and fault alerts
Dedicated state estimation algorithms for MV and LV grids are used to accurately assess voltage levels and loadings for all operating assets in the grid. The state estimation calculations are performed every minute. Incidents are reported through notifications and warnings.
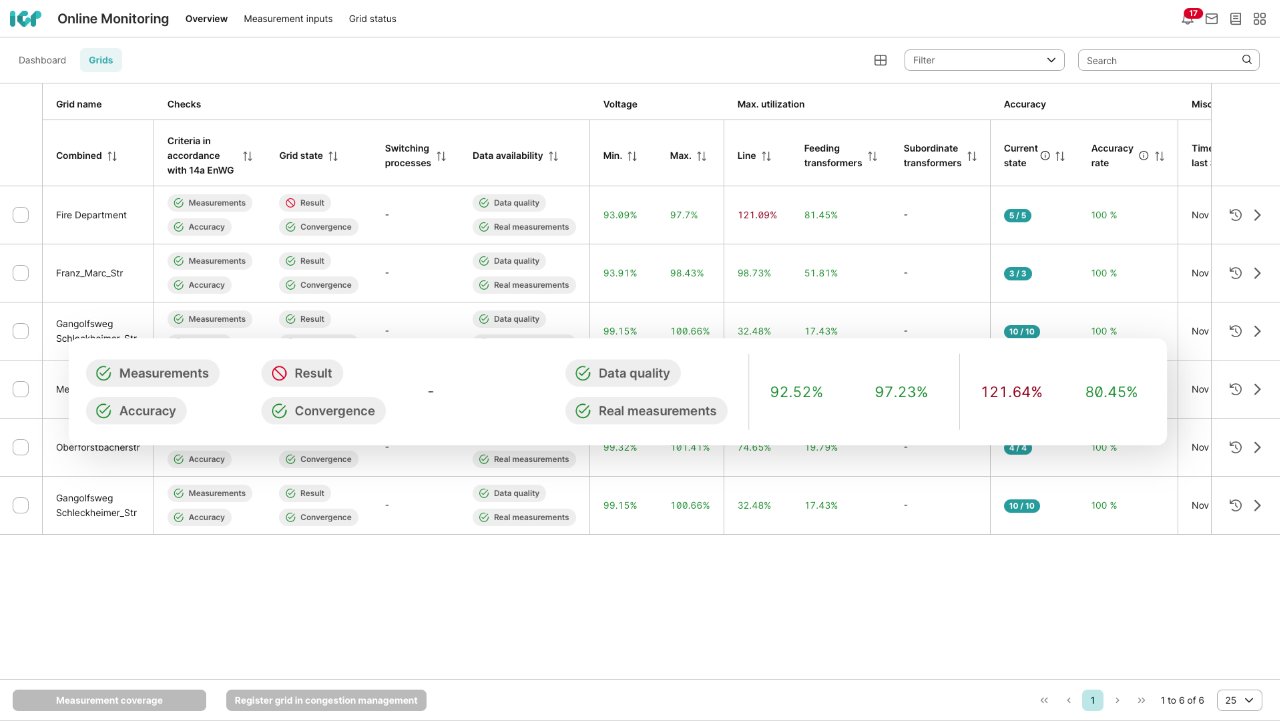
A function developed from real-world implementation projects also allows you to deactivate individual faulty data points in the Online Monitoring app. This helps safeguard the quality of the state estimation by excluding incorrect inputs – e.g., from installation or transmission errors – from the assessment until they are clarified.
The app also clearly indicates whether enough measurements are available to perform a valid state estimation – or whether any data is missing entirely.
Track input data transparently
With the Measurement Analyzer, every state estimation becomes traceable: You can see which data points were used for a specific state estimation run and how much the calculated values deviate from the input data. This way, you gain full transparency of the data basis, can check anomalies more precisely, and quickly detect possible data quality issues.
These DSOs are already using our Online Monitoring App to improve transparency of the current grid state

Grid smartification
With the full overview of the grid state at your fingertips, you’ll have the basis for an automated congestion management of flexible loads or generators in the second step. In the long run, this will enable smart grid operation and reduced need for grid expansion.

Power supply quality
You can detect grid congestion risks early on and take timely action to minimise – or even prevent – the strain on the grid. Moreover, you can improve the overall grid operations through e.g.optimisation of switching states.

Costs management
Thanks to live transparency of grid states, you’ll have a much more solid data basis for prioritisation of maintenance work and for planning grid expansion measures. This, in turn, leads to reduced costs for grid planning and operation.
Contact person
Dr. Tobias Falke
VP Global Sales & Marketing